What the data says about two-minute drill play calling
Everyone has an opinion about two-minute drill play calling, and most of those opinions come from remembering the one that worked. This is the other way to look at it: take 1,095 real late-game situations, work out which available call left the team with the highest win probability, and then count up the answers. Some of what comes out is obvious. Several of the results are not.
How we measured it
Every situation in the set is a real play from a real NFL game between 2018 and 2026, taken from nflverse play-by-play. For each one we keep the game state a coach would know: score, quarter, clock, field position, down, distance and timeouts. We then attach a win probability to each call the situation actually allowed — run, pass, punt, or field goal — estimated from how often teams in comparable states went on to win.
The "best call" in this article means the call with the highest win probability in that state. It does not mean the call that produced the best result. Those are different things, and conflating them is the most common mistake in this whole discussion.
The whole picture
Across all 1,095 situations, passing is the best call a little more than half the time. Running is best about a third of the time. Punting is best in 8% of them, and a field goal is best almost never.
| Best call | Share of situations |
|---|---|
| Pass | 57.2% |
| Run | 34.7% |
| Punt | 8.0% |
| Field goal | 0.1% |
That field goal number is the first surprise. Kicking a field goal is one of the most common late-game decisions in football, and yet in this sample it was almost never the highest-win-probability option. The reason is not that kicking is stupid. It is that these situations are selected for a narrow band of the game: late, close, and usually with the clock as the binding constraint. In that band, trading a down for three points frequently costs more than it buys.
Fourth down is where the money is
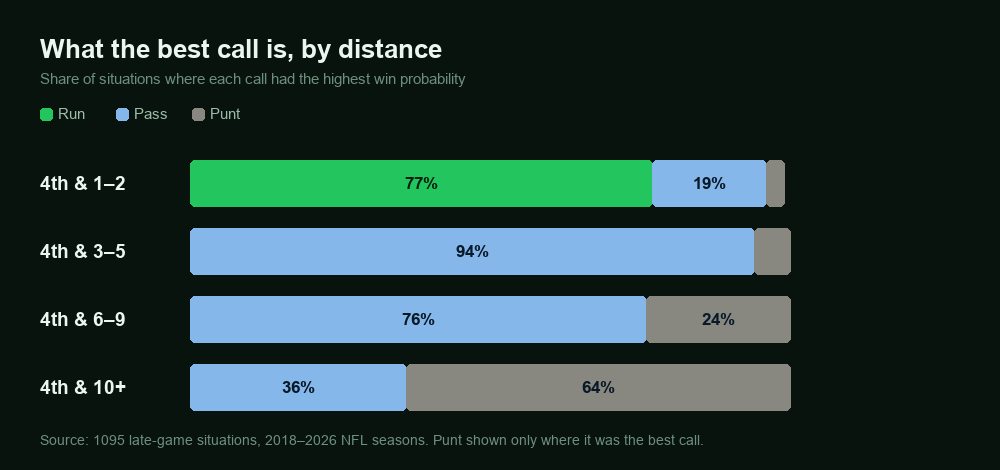
Split fourth down by distance and the picture becomes almost a different game. This is the part of two-minute drill play calling where intuition and arithmetic disagree most.
| Fourth down | Situations | Run | Pass | Punt |
|---|---|---|---|---|
| 1–2 yards | 105 | 77% | 19% | 3% |
| 3–5 yards | 68 | 0% | 94% | 6% |
| 6–9 yards | 98 | 0% | 76% | 24% |
| 10+ yards | 89 | 0% | 36% | 64% |
Three things stand out. First, at one or two yards, running is right 77% of the time but passing is still right in nearly one in five — the "just sneak it" instinct is broadly correct but not universal. Second, and this is the one that surprises people, from three to five yards to go, running was never the best call in this sample. Not once. Passing was right 94% of the time.
Third, punting only becomes the majority choice past ten yards, and even there it is not dominant. Of the 88 situations in the whole dataset where punting was the best call, every single one was on fourth down, with an average of 12.4 yards still to go and 85 seconds left. Punting, when it is right, is right for a specific reason: long distance, limited time, and a defense that only has to stop one thing.
Down and distance together
The same logic runs backwards on earlier downs, which is why calling a whole drive by feel tends to drift. On first down, passing was the best call in 69% of situations. On second down, 78%. On third down it flips: running was best 67% of the time, because a third down in these states is usually short and the clock rewards keeping the ball moving in bounds.
| Down | Situations | Best call | Runner-up |
|---|---|---|---|
| First | 173 | Pass 69% | Run 31% |
| Second | 292 | Pass 78% | Run 22% |
| Third | 270 | Run 67% | Pass 33% |
| Fourth | 360 | Pass 53% | Punt 24% |
The fourth-down numbers deserve their own treatment, because the scoreboard turns out to matter more than the distance: see what 360 fourth-down decisions show.
Then the clock changes it again
Time left does not just scale the urgency, it changes which call is best. Inside the final minute, passing was the best call 74% of the time — the sideline becomes the offense's best friend because an incompletion stops the clock for free. With between one and two minutes left, running and passing split almost evenly. With more than two minutes left, running edges ahead, because time is no longer scarce enough to justify the risk of an incompletion.
What coaches actually do
Now the interesting part. If you compare the call that was actually made with the call that had the highest win probability, they agree 67% of the time across the sample. The agreement rate falls as the stakes rise: 78% on first down, 86% on second, 58% on third, and only 53% on fourth.
That fall is not a coincidence. Fourth down is where the cost of being wrong is both largest and most visible, and it is also where the average decision gave up the most win probability: 3.4 percentage points, against 0.8 on first and second down and 1.8 on third.
| Down | Matched the best call | Average win chance given up |
|---|---|---|
| First | 78.0% | 0.8 pts |
| Second | 85.6% | 0.8 pts |
| Third | 58.1% | 1.8 pts |
| Fourth | 53.1% | 3.4 pts |
There is a visible pattern in what coaches do differently. They kick field goals far more often than the numbers justify — 9.1% of real calls were field goals, against 0.1% of best calls — and they run less often than the numbers like, 24.7% against 34.7%. Both deviations point the same way: toward the option that avoids the most obvious blame if it fails.
Why the gap exists
It would be lazy to read this as coaches being bad at their jobs. Four things are going on, and only one of them is about judgment.
First, the model does not know the opponent. It knows the game state, not that the left tackle is playing on one leg or that the cornerback has been beaten twice on the same route.
Second, the model does not know the play call. "Pass" covers a screen and a twenty-yard out, and those are not the same decision. A coach choosing a low-risk pass is not making the same bet the model is pricing.
Third, survival pressure is real. A coach who goes for it on fourth down and fails is asked about it for a week; a coach who punts and loses is asked about the defense. That asymmetry is well documented and it does not show up anywhere in a win probability table.
Fourth, and least discussed, the estimate itself is built from what teams have historically done. If the league systematically under-uses a good option, the estimate inherits some of that bias. That is a real limitation and we would rather say it than pretend the numbers are neutral.
What this does and does not tell you
It tells you what the average team, in that exact state, gained or lost by choosing one call over another. It is a good guide to which decisions are close and which are not.
It does not tell you what would have happened. A call that was right can fail, and a call that was wrong can work, and the scoreboard records neither of those facts. If you take one thing from this article, take that one: in the situations counted here, the result of the play and the quality of the decision are separate measurements.
That separation is the whole design of the daily Two-Minute Drill game. You get a real situation, you make the call, and you are graded on what the call was worth rather than on how it turned out. If you want the background first, what a two-minute drill is covers the three versions and why the clock changes everything.
Data note: play-by-play from nflverse under CC BY-SA 4.0, modified and re-aggregated. Win probability is estimated from historical outcomes in comparable game states. Sample: 1,095 situations from the 2018–2026 regular and post seasons. Percentages are rounded and may not sum to 100.